File:39 amplitudes and phases.png
From RHESSI Wiki

No higher resolution available.
39_amplitudes_and_phases.png (500 × 200 pixels, file size: 4 KB, MIME type: image/png)
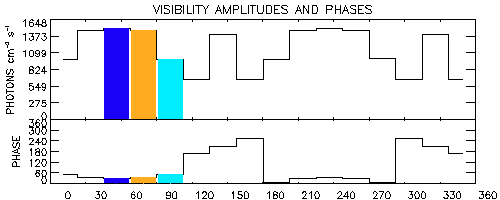
Visibility amplitudes and phases derived from the stacked counts in Figure 2d. Roll bins #3,4 & 5 taken from the three selected regions are shown in the same colors as the previous figure.
File history
Click on a date/time to view the file as it appeared at that time.
| Date/Time | Thumbnail | Dimensions | User | Comment | |
|---|---|---|---|---|---|
| current | 23:42, 11 September 2009 | 500×200 (4 KB) | Schriste (Talk | contribs) | (Visibility amplitudes and phases derived from the stacked counts in Figure 2d. Roll bins #3,4 & 5 taken from the three selected regions are shown in the same colors as the previous figure.) |
- Edit this file using an external application (See the setup instructions for more information)
File links
The following page links to this file: