File:Mem njit event3 fwhm arc2.jpg
From RHESSI Wiki

Size of this preview: 603 × 599 pixels
Full resolution (1,059 × 1,052 pixels, file size: 297 KB, MIME type: image/jpeg)
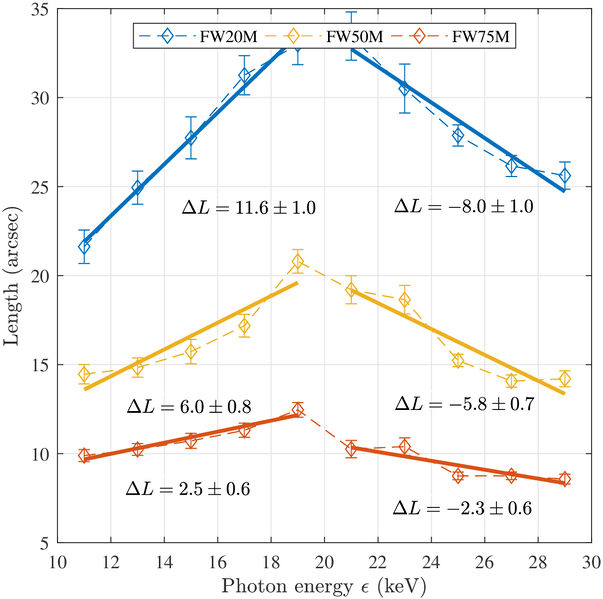
Coronal source length measured along the loop spine plotted vs. photon energy. The lengths were determined as the distances between the positions at which the intensity along the arc dropped to 75% (blue), 50% (orange), and 20% (red) of the peak value in each energy bin. The Solid lines indicate the best fit to the data points from 10 to 20 keV and from 20 to 30 keV. The changes in length (Delta L) over these two energy ranges are shown on the plot.
File history
Click on a date/time to view the file as it appeared at that time.
| Date/Time | Thumbnail | Dimensions | User | Comment | |
|---|---|---|---|---|---|
| current | 21:18, 21 September 2018 |  | 1,059×1,052 (297 KB) | Bdennis (Talk | contribs) | (Coronal source length measured along the loop spine plotted vs. photon energy. The lengths were determined as the distances between the positions at which the intensity along the arc dropped to 75% (blue), 50% (orange), and 20% (red) of the peak value in ) |
- Edit this file using an external application (See the setup instructions for more information)
File links
The following page links to this file: