Weekly Report 10Dec2010
From RHESSI Wiki
(→RHESSI Imaging Test) |
(→RHESSI Imaging Test) |
||
| Line 12: | Line 12: | ||
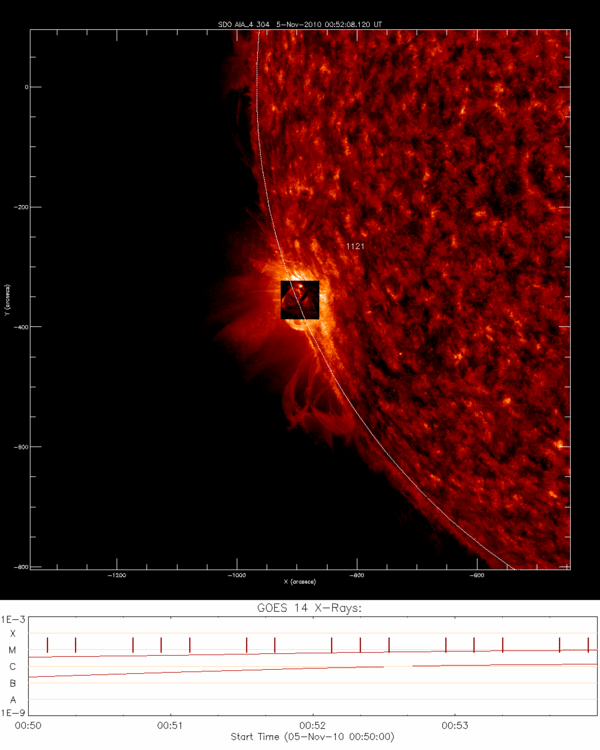
[[File:AIA 5Nov2010.gif|center|thumb|600px|The AIA 304 wavelength image of the 5Nov2010 flare near the limb at 00:52:00.]] | [[File:AIA 5Nov2010.gif|center|thumb|600px|The AIA 304 wavelength image of the 5Nov2010 flare near the limb at 00:52:00.]] | ||
| - | The | + | The box shows the area of the sun where the flare occurred. The purpose of this image is to see if the flare occurs on the disk or if it is occulted. The cutouts of the region the flare occurred in where too tight, unfortunately new requests to the cutout service have not been processed as yet. |
| + | |||
| + | The pixon image of the 5Nov2010 flare is below. | ||
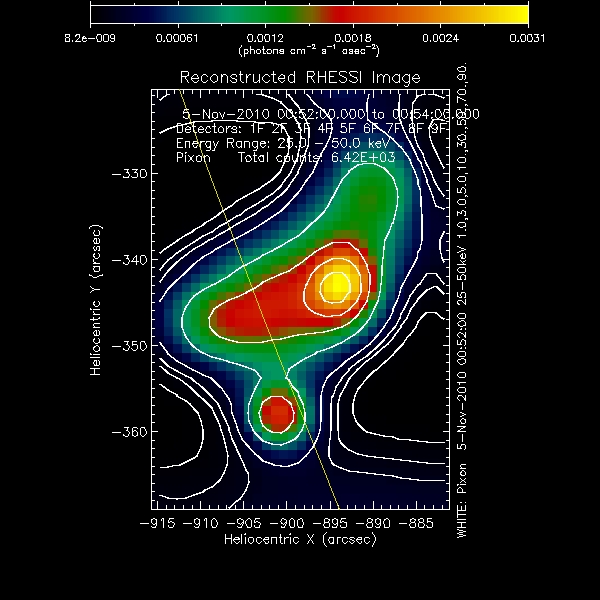
[[File:5Nov2010 d1tod9.jpg |center|thumb|600px|The pixon image of the 5Nov2010 flare with contours.]] | [[File:5Nov2010 d1tod9.jpg |center|thumb|600px|The pixon image of the 5Nov2010 flare with contours.]] | ||
| + | The contours on the map are the 1,3,5,10,30,50,70,and 90% contours. | ||
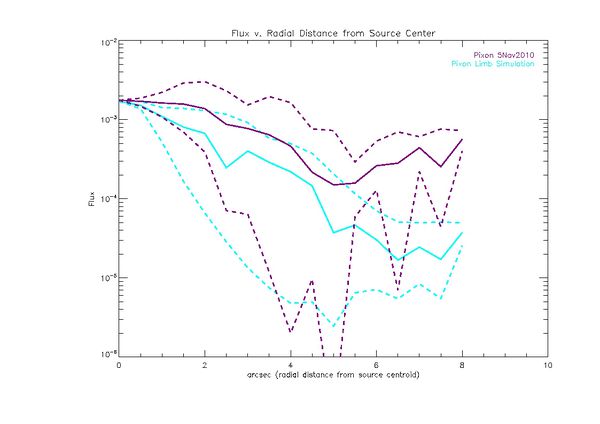
[[File:Pixon limb 5nov2010 sim.jpg |center|thumb|600px|The plot shows the flux as a function of radial distance from the centroid of the pixon image for the 5Nov2010 event (Purple) compared to the the same profiles for the simulated data (Cyan)]] | [[File:Pixon limb 5nov2010 sim.jpg |center|thumb|600px|The plot shows the flux as a function of radial distance from the centroid of the pixon image for the 5Nov2010 event (Purple) compared to the the same profiles for the simulated data (Cyan)]] | ||
===RHESSI Pixon Albedo Imaging Test=== | ===RHESSI Pixon Albedo Imaging Test=== | ||
Revision as of 20:48, 16 December 2010
RHESSI Website Migration
New additions were made to the RHESSI Website. Some new content was added to site and old content was reformatted. The biggest changes were additional extensions added to the typo3 framework. The most significant of the new additions is the HTML reader. This allows pages written in HTML to be added to typo3, the HTML is stripped and the layout is preserved in typo3 script. I'm currently configuring this, it's not working quite correctly.
RHESSI Imaging Test
The following is a comparison between the observed event on 5Nov2010 and the simulated albedo event near the limb from Eduard Kontar's study.
The image below is the SDO AIA 304 image of the sun during the event.
The box shows the area of the sun where the flare occurred. The purpose of this image is to see if the flare occurs on the disk or if it is occulted. The cutouts of the region the flare occurred in where too tight, unfortunately new requests to the cutout service have not been processed as yet.
The pixon image of the 5Nov2010 flare is below.
The contours on the map are the 1,3,5,10,30,50,70,and 90% contours.


