Weekly Report 25Mar2011
From RHESSI Wiki
(Created page with "===RHESSI Albedo Imaging Test=== The RHESSI Albedo Imaging test continued. The following steps were attempted with Clean: *Clean images were made from maps that contained two ...") |
(→RHESSI Albedo Imaging Test) |
||
| (10 intermediate revisions not shown) | |||
| Line 3: | Line 3: | ||
The RHESSI Albedo Imaging test continued. | The RHESSI Albedo Imaging test continued. | ||
| - | The following steps were attempted with Clean: | + | The following steps were attempted with Pixon an Clean: |
| - | *Clean images were made from maps that contained two circular Gaussian sources. | + | *Pixon and Clean images were made from maps that contained two circular Gaussian sources. |
| - | *The sources were centered at | + | *The sources were centered at locations 6 arcsecs apart. |
| - | *One source was compact (standard deviation of 2 arcsecs) while the other was extended | + | *One source was compact (standard deviation of 2 arcsecs) while the other was extended (standard deviation of 12 arcsecs). |
| - | * | + | *Pixon and Clean images were made with three detector combinations 1-9, 1-4, and 4-9. |
| + | *The Clean images were made with a clean beam width factor of 2. | ||
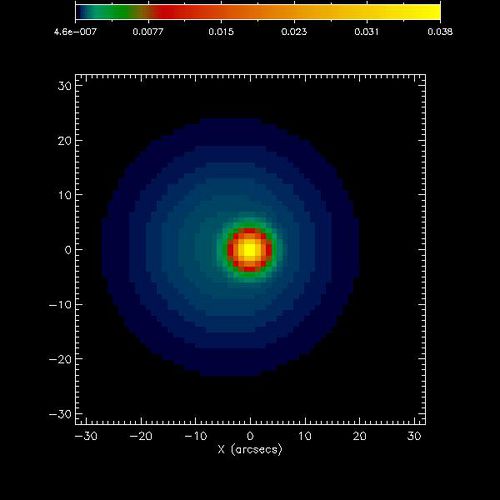
| + | The map below was the original map used to create the calibrated eventlist files. The two sources are normalized to the same value. The counts in each source are equal. | ||
| + | [[File:Orig map two sources.jpg |center|thumb|500px|]] | ||
| + | |||
| + | The table below shows the detector combinations, the imaging algorithms, and the results for the centroid and standard deviations in each case. The locations and standard deviations are in arcseconds. | ||
{| class="wikitable" | {| class="wikitable" | ||
|- | |- | ||
| - | |Original Map||Centroid|| | + | |'''Original Map Configuration'''||'''Imaging Algorithm'''||'''Detectors Used'''||'''Image Centroid X'''||'''Image Centroid Y'''||'''ST DEV X'''||'''ST DEV Y'''|| |
| - | |- | + | |- |
| - | | | + | |Two Circular Gaussian Sources (offset by 6 arcsec)||Pixon||1 to 9||907.47||256.34||9.64||9.64|| |
| + | |- | ||
| + | |Two Circular Gaussian Sources (offset by 6 arcsec)||Pixon||4 to 9||907.21||256.18||9.38||9.56|| | ||
| + | |- | ||
| + | |Two Circular Gaussian Sources (offset by 6 arcsec)||Pixon||1 to 4||910.37||255.26||2.27||2.12|| | ||
| + | |- | ||
| + | |Two Circular Gaussian Sources (offset by 6 arcsec)||Clean||1 to 9||907.59||256.18||8.98||9.02|| | ||
| + | |- | ||
| + | |Two Circular Gaussian Sources (offset by 6 arcsec)||Clean||1 to 4||910.87||255.92||5.97||5.82|| | ||
| + | |- | ||
| + | |Two Circular Gaussian Sources (offset by 6 arcsec)||Clean||4 to 9||907.83||256.21||9.75||9.83|| | ||
|} | |} | ||
| + | |||
| + | The centroids for both the Pixon and Clean images were in the same approximate locations. The centroids and standard deviations were all calculated using the flux tool. A circle of radius 30 arcsecs was placed around the image. | ||
| + | *For the images that involved the coarser detectors both Clean and Pixon found a centroid at ~907 arcsec. | ||
| + | *This location is around halfway between the center of the compact source and the center of the extended source. | ||
| + | *For the images using grids 1 to 4 only the centroid was located at ~910 arcsec. | ||
| + | *This was the location of the compact source in the original. The fine grids are seeing the compact source in both image algorithms. The extended source is not affecting the centroid. | ||
| + | *Using the coarser detectors the flux tool yields a standard deviation of ~9.5 arcsec in the X and Y directions. The extended source has a standard deviation of 12 arcsecs both directions. With the additional flux in the image from the compact source the overall standard deviation should be smaller than 12 arcsec so this is consistent with expectations. | ||
| + | *When using detectors 1 to 4 Pixon yields a standard deviation of slightly larger than 2 arcsec in both directions. Pixon is reproducing the parameters of the compact source when using the finer detectors. Clean finds a much larger standard deviation. With a maximum of 500 iterations Clean finds components outside of the compact source increasing the standard deviation. This may be a result of over cleaning the image. | ||
| + | |||
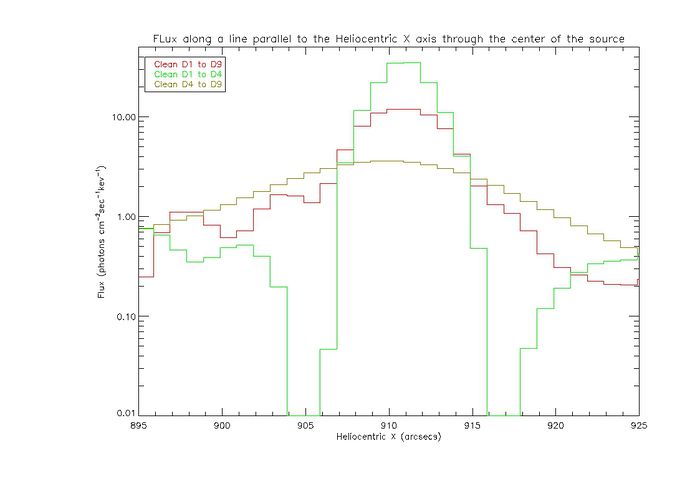
| + | The plot below shows the flux profile in the Heliocentric X direction for the Clean images through the location of the centroid. The images were made from the map shown above. | ||
| + | |||
| + | [[File:Clean profiles two sources.jpg|center|thumb|700px|The plot shows the flux profiles of images made with Clean from a map with two offset Gaussian sources, one with a standard deviation of two arcsecs and one with a standard deviation of 10 arcsec. The seperation of the two sources is 4 arcsecs. The plots were made from images using detectors 1 to 9, detectors 1 to 4, and detectors 4 to 9.]] | ||
| + | |||
| + | |||
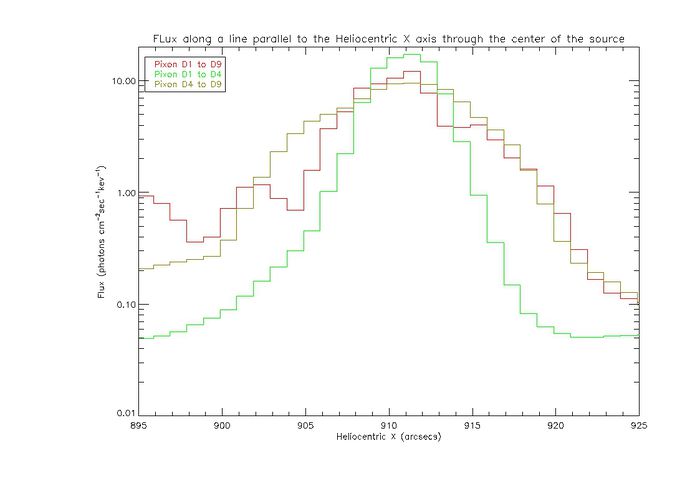
| + | The plot below shows the flux profile in the Heliocentric X direction for the Pixon images through the location of the centroid. The images were made from the map shown above. | ||
| + | |||
| + | |||
| + | [[File:Pixon profiles two sources.jpg|center|thumb|700px|The plot shows the flux profiles of images made with Pixon from a map with two offset Gaussian sources, one with a standard deviation of two arcsecs and one with a standard deviation of 10 arcsec. The seperation of the two sources is 4 arcsecs. The plots were made from images using detectors 1 to 9, detectors 1 to 4, and detectors 4 to 9.]] | ||
| + | |||
| + | *The profiles for the Pixon and Clean images show some commonalities. The peak of the image is at peak of the compact source. | ||
| + | *For detectors 1 to 4 a profile that is more sharply peaked appears. For the clean profile that is a sharp peak around the compact source and a steep drop off. There are then pockets of flux on either side. These may be due to side lobes that are not properly cleaned. For Pixon there is a sharp peak with a smooth drop off to the edges. | ||
| + | *For detectors 4 to 9 the profile is similar for Pixon and Clean. The peak of the compact source is smeared out and the flux of the image drops off much more slowly. This accounts for the centroid moving to a position between the center of compact and extended sources. | ||
| + | *For detectors 1 to 9 for both imaging algorithms we again have similar results. Using the finer detectors some more structure shows up in the profile. A small peak appears around where the extended source is centered and the peak around the compact source is more defined. The overall profile appears smeared in both cases. | ||
| + | |||
| + | ===Goals=== | ||
| + | *Run tests checking the peak of images using each detector individually for maps containing a compact source and an extended source | ||
| + | *Check the resolution of Pixon with maps containing sources different distances apart to see at what separations Pixon can differentiate sources of varying strengths and extent. | ||
| + | *Run pixon tests with different maps. One with an extended source closer to the disc center as done above to simulate foreshortening of the albedo, and one with an extended source closer to the limb to simulate a solar source. | ||
Latest revision as of 23:00, 30 March 2011
RHESSI Albedo Imaging Test
The RHESSI Albedo Imaging test continued.
The following steps were attempted with Pixon an Clean:
- Pixon and Clean images were made from maps that contained two circular Gaussian sources.
- The sources were centered at locations 6 arcsecs apart.
- One source was compact (standard deviation of 2 arcsecs) while the other was extended (standard deviation of 12 arcsecs).
- Pixon and Clean images were made with three detector combinations 1-9, 1-4, and 4-9.
- The Clean images were made with a clean beam width factor of 2.
The map below was the original map used to create the calibrated eventlist files. The two sources are normalized to the same value. The counts in each source are equal.
The table below shows the detector combinations, the imaging algorithms, and the results for the centroid and standard deviations in each case. The locations and standard deviations are in arcseconds.
| Original Map Configuration | Imaging Algorithm | Detectors Used | Image Centroid X | Image Centroid Y | ST DEV X | ST DEV Y | |
| Two Circular Gaussian Sources (offset by 6 arcsec) | Pixon | 1 to 9 | 907.47 | 256.34 | 9.64 | 9.64 | |
| Two Circular Gaussian Sources (offset by 6 arcsec) | Pixon | 4 to 9 | 907.21 | 256.18 | 9.38 | 9.56 | |
| Two Circular Gaussian Sources (offset by 6 arcsec) | Pixon | 1 to 4 | 910.37 | 255.26 | 2.27 | 2.12 | |
| Two Circular Gaussian Sources (offset by 6 arcsec) | Clean | 1 to 9 | 907.59 | 256.18 | 8.98 | 9.02 | |
| Two Circular Gaussian Sources (offset by 6 arcsec) | Clean | 1 to 4 | 910.87 | 255.92 | 5.97 | 5.82 | |
| Two Circular Gaussian Sources (offset by 6 arcsec) | Clean | 4 to 9 | 907.83 | 256.21 | 9.75 | 9.83 |
The centroids for both the Pixon and Clean images were in the same approximate locations. The centroids and standard deviations were all calculated using the flux tool. A circle of radius 30 arcsecs was placed around the image.
- For the images that involved the coarser detectors both Clean and Pixon found a centroid at ~907 arcsec.
- This location is around halfway between the center of the compact source and the center of the extended source.
- For the images using grids 1 to 4 only the centroid was located at ~910 arcsec.
- This was the location of the compact source in the original. The fine grids are seeing the compact source in both image algorithms. The extended source is not affecting the centroid.
- Using the coarser detectors the flux tool yields a standard deviation of ~9.5 arcsec in the X and Y directions. The extended source has a standard deviation of 12 arcsecs both directions. With the additional flux in the image from the compact source the overall standard deviation should be smaller than 12 arcsec so this is consistent with expectations.
- When using detectors 1 to 4 Pixon yields a standard deviation of slightly larger than 2 arcsec in both directions. Pixon is reproducing the parameters of the compact source when using the finer detectors. Clean finds a much larger standard deviation. With a maximum of 500 iterations Clean finds components outside of the compact source increasing the standard deviation. This may be a result of over cleaning the image.
The plot below shows the flux profile in the Heliocentric X direction for the Clean images through the location of the centroid. The images were made from the map shown above.

The plot below shows the flux profile in the Heliocentric X direction for the Pixon images through the location of the centroid. The images were made from the map shown above.

- The profiles for the Pixon and Clean images show some commonalities. The peak of the image is at peak of the compact source.
- For detectors 1 to 4 a profile that is more sharply peaked appears. For the clean profile that is a sharp peak around the compact source and a steep drop off. There are then pockets of flux on either side. These may be due to side lobes that are not properly cleaned. For Pixon there is a sharp peak with a smooth drop off to the edges.
- For detectors 4 to 9 the profile is similar for Pixon and Clean. The peak of the compact source is smeared out and the flux of the image drops off much more slowly. This accounts for the centroid moving to a position between the center of compact and extended sources.
- For detectors 1 to 9 for both imaging algorithms we again have similar results. Using the finer detectors some more structure shows up in the profile. A small peak appears around where the extended source is centered and the peak around the compact source is more defined. The overall profile appears smeared in both cases.
Goals
- Run tests checking the peak of images using each detector individually for maps containing a compact source and an extended source
- Check the resolution of Pixon with maps containing sources different distances apart to see at what separations Pixon can differentiate sources of varying strengths and extent.
- Run pixon tests with different maps. One with an extended source closer to the disc center as done above to simulate foreshortening of the albedo, and one with an extended source closer to the limb to simulate a solar source.
