Weekly Report 25Mar2011
From RHESSI Wiki
(Difference between revisions)
(→RHESSI Albedo Imaging Test) |
|||
| Line 33: | Line 33: | ||
| - | [[File:Pixon profiles two sources.jpg|center|thumb| | + | [[File:Pixon profiles two sources.jpg|center|thumb|700px|The plot shows the flux profiles of images made with Pixon from a map with two offset Gaussian sources, one with a standard deviation of two arcsecs and one with a standard deviation of 10 arcsec. The seperation of the two sources is 4 arcsecs. The plots were made from images using detectors 1 to 9, detectors 1 to 4, and detectors 4 to 9. ]] |
Revision as of 19:04, 30 March 2011
RHESSI Albedo Imaging Test
The RHESSI Albedo Imaging test continued.
The following steps were attempted with Clean:
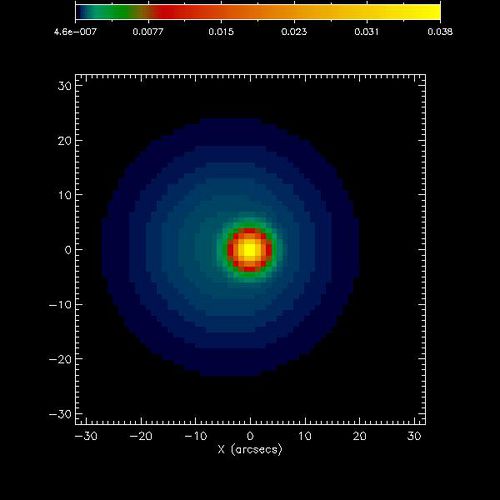
- Clean images were made from maps that contained two circular Gaussian sources.
- The sources were centered at the same location in the original map.
- One source was compact (standard deviation of 2 arcsecs) while the other was extended
| Original Map Configuration | Imaging Algorithm | Detectors Used | Image Centroid X | Image Centroid Y | Standard Deviation X | |
| Two Circular Gaussian Sources (offset by 4 arcsec) | Pixon | 1 to 9 | 907.47 | 256.34 | 9.64 | |
| Two Circular Gaussian Sources (offset by 4 arcsec) | Pixon | 4 to 9 | 907.21 | 256.18 | 9.38 | |
| Two Circular Gaussian Sources (offset by 4 arcsec) | Pixon | 1 to 4 | 910.37 | 255.26 | 2.27 | |
| Two Circular Gaussian Sources (offset by 2 arcsec) | Pixon | 1 to 4 | 910.79 | 255.26 | 2.46 | |
| Two Circular Gaussian Sources (offset by 2 arcsec) | Pixon | 4 to 9 | 910.59 | 255.85 | 4.05 | |
| Two Circular Gaussian Sources (offset by 2 arcsec) | Pixon | 1 to 9 | 910.37 | 255.26 | 3.59 |

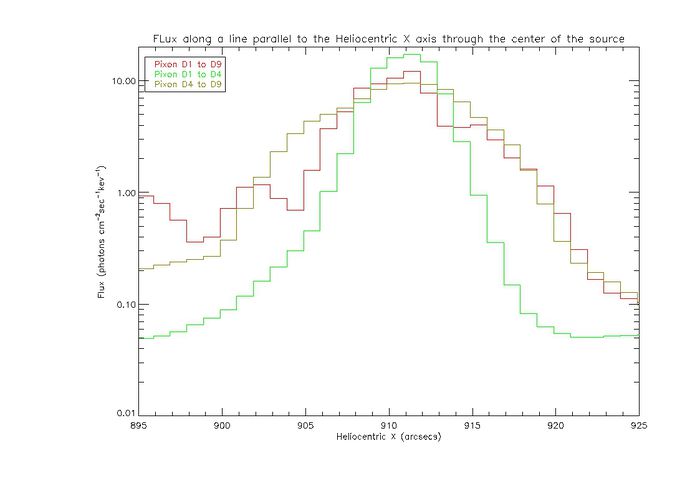
The plot shows the flux profiles of images made with Pixon from a map with two offset Gaussian sources, one with a standard deviation of two arcsecs and one with a standard deviation of 10 arcsec. The seperation of the two sources is 4 arcsecs. The plots were made from images using detectors 1 to 9, detectors 1 to 4, and detectors 4 to 9.
