Tracing the sources of gradual solar energetic particle events
From RHESSI Wiki
| Nugget | |
|---|---|
| Number: | 405 |
| 1st Author: | David H. BROOKS |
| 2nd Author: | Stephanie L. YARDLEY |
| Published: | 29 March 2021 |
| Next Nugget: | Negative ribbons explained |
| Previous Nugget: | The Superflare SOL2017-09-06: from submm to mid-IR |
| List all | |
Contents |
Background
Solar energetic particles (SEPs) have traditionally been categorised into two types of events: impulsive - linked with flares and jets - and gradual, accelerated by shocks associated with coronal mass ejections (CMEs). Impulsive SEP events onset quickly, whereas gradual events may last for days. Due to their longer duration, higher particle fluxes, and greater longitudinal extent, gradual events are seen as the bigger threat to our technological infrastructure. As such, forecasting them has attracted interest from governments and industry as part of space weather mitigation efforts. Of course there is also great scientific interest in their acceleration processes and where they originate from. When we say a CME-shock accelerates SEPs, that does not tell us what the source of the shocked material is.
One way we can try to locate the sources is to use the SEP elemental abundance signature. Like the slow speed solar wind (SSW), SEPs show an enrichment of elements with a low (<10 eV) first ionisation potential (FIP) relative to elements with a high FIP. This makes it difficult to disentangle SEP and SSW sources based on mapping the elemental abundances in the corona, for example.
Sulphur (S) is an interesting case. Because it lies on the boundary between low- and high-FIP elements, it shows distinctly different behaviour in different environments. For this reason, it has historically been seen as problematic for looking at the FIP effect. For the same reason, however, it has significant diagnostic potential. The Si/S abundance ratio is higher in SEPs than in the slow solar wind, and sometimes much higher (see e.g. Ref. [1]).
Tracing the sources
In Ref. [2] we have used Si/S measurements from the WIND and Hinode spacecrafts to try to trace the sources of several SEP events in January 2014. WIND detected three significant SEP events between January 5th and 12th, following a series of major flares from active region AR 11944.
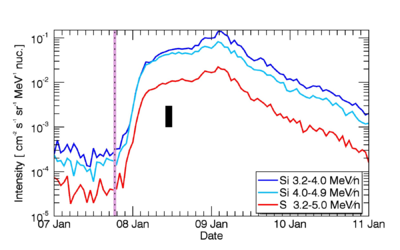
In this Nugget, we focus on the SOL2014-01-07 (X1.2) event. Figure 1 shows the detection of the SEPs at WIND. Intensities in all three Si and S channels increased by more than two orders of magnitude following the X1.2 flare. The Si/S abundance can be tracked by taking the ratio of these intensity channels normalised to the photospheric abundance ratio. Note that the base level is already elevated from the previous event, which may be an indication of a pile-up of available suprathermal particles.

The source active region of the X1.2 flare is shown in Figure 2 (region with the brightest, high temperature - 7 MK - loops). Hinode EIS (EUV Imaging Spectrometer) scanned this region and an image with spectroscopic diagnostics is shown in Figure 3.
The high Si/S abundance ratio signature detected by WIND, observing near Earth, corresponds to the red contours in the bright emission in the core of the active region as seen in the EIS images. This emission is usually called "moss", and represents the footpoints of the high temperature loops. Scattered around and away from the moss, lower, but still elevated, levels of Si/S ratios are seen (pink contours). Some of these regions are close to areas of blue-shifted upflows in the Doppler map, but the highest Si/S abundance ratios appear predominantly in the moss regions at the footpoints of the high temperature loops.

Physical conditions in the source region
The EIS imaging spectroscopy of the source region (Figure 3) suggests that the plasma is confined close to the region where the elemental separation takes place: in the chromosphere. Based on theoretical models of the FIP effect Ref. [3], the EIS measurements further imply that the mechanism operates at the top of the chromosphere.
Furthermore, the EIS scan includes capability for a magnetic-field measurement in the form of a diagnostic involving a magnetically induced transition of Fe X. The field strength in this region is on the order of several hundred Gauss i.e. the confinement strength for the plasma is high. However, this plasma must escape, somehow; and the X-class flare is a powerful agent that facilitates the process. In contrast, regular, enhanced-composition material away from the loop footpoints appears to be able to flow freely in the blue-shifted outflows, or escape by less dramatic field-line opening.
Going forward
We have looked at just a few events, so the next step is to see if these findings are general, or not. In the future, Solar Orbiter should also allow similar studies to be made as we ramp up towards solar maximum. Parker Solar Probe has already detected evidence of radio noise storms, associated with outflow regions at the boundaries of active regions - a somewhat different topic from what we present here, but highly related given the link with magnetic topological changes between closed-field loops in the active-region core and open field at the periphery.
References
[1] "Solar Energetic Particles"
[2] "The source of the major solar energetic particle events from super active region 11944"
[3] https://ui.adsabs.harvard.edu/abs/2015LRSP...12....2L "The FIP and Inverse FIP Effects in Solar and Stellar Coronae"]
| RHESSI Nugget Date | 29 March 2021 + |
| RHESSI Nugget First Author | David H. BROOKS + |
| RHESSI Nugget Index | 405 + |
| RHESSI Nugget Second Author | Stephanie L. YARDLEY + |
